Last Weeks Summary
U.S. "Red-Folder" (High-Impact) Economic Events: Week of September 14–20, 2025
Lorem ipsum dolor sit amet, consectetur adipiscing elit. Ut elit tellus, luctus nec ullamcorper mattis, pulvinar dapibus leo.
Key Highlights & Market Context
Overall Trend: After a dip early in the week, the Nasdaq-100 futures rebounded, climbing closer to its 52-week high of ~24,068.50.
Jobs Data & Fed Expectations: A weak U.S. non farm payroll report for August just 22,000 jobs added versus expectations of 75,000 sent futures higher (Nasdaq-100 rising ~0.65%) on heightened expectations of Fed rate cuts.
Sector Drivers: Broadcom’s strong earnings and optimistic AI revenue guidance boosted sentiment, helping lift Nasdaq and S&P futures.
Summary: Early-week weakness (on Sept 2) gave way to a recovery through Fri, largely driven by dovish Fed speculation and tech sector optimism. Gains, however, were modest as investors awaited more clarity.
Weekly Summary: NASDAQ-100 Futures (Sept 1–5, 2025)
Start: 23,444.50 (–0.07%)
Midweek Low: 23,275.00 (–0.72% on Sept 2)
Recovery Phase:
+0.75% on Sept 3
+0.94% on Sept 4
Close: 23,684.00 (+0.07% on Sept 5)
Driver: Weak jobs data and Broadcom’s upbeat earnings outlook

Tuesday, September 16
Core Retail Sales (m/m) – closely watched indicator of retail sector health
Retail Sales (m/m) – broad measure of consumer spending
Import Prices (m/m) – affects inflation expectations and currency strength
Industrial Production (m/m) – gauge of manufacturing output
Capacity Utilization Rate – reflects economic slack or overheating
Business Inventories (m/m) – informs on wholesale and manufacturing restocking
NAHB Housing Market Index – sentiment indicator for the U.S. housing sector
Wednesday, September 17
Building Permits – forward-looking indicator of housing starts
Housing Starts – actual data on the start of new housing construction
Crude Oil Inventories – U.S. petroleum stock changes, influences USD and commodities
Thursday, September 18
Unemployment Claims – weekly snapshot of labor market health
Philly Fed Manufacturing Index – regional manufacturing sentiment
Wednesday, September 17 (Later)
Federal Funds Rate decision – major monetary policy event
FOMC Economic Projections – updated forecasts by the Fed
FOMC Statement – official narrative on economic policy
FOMC Press Conference – often market-moving due to Q&A clarity
Higher Time Frame Evaluation
Daily - Phase 1 - Overall Bullish
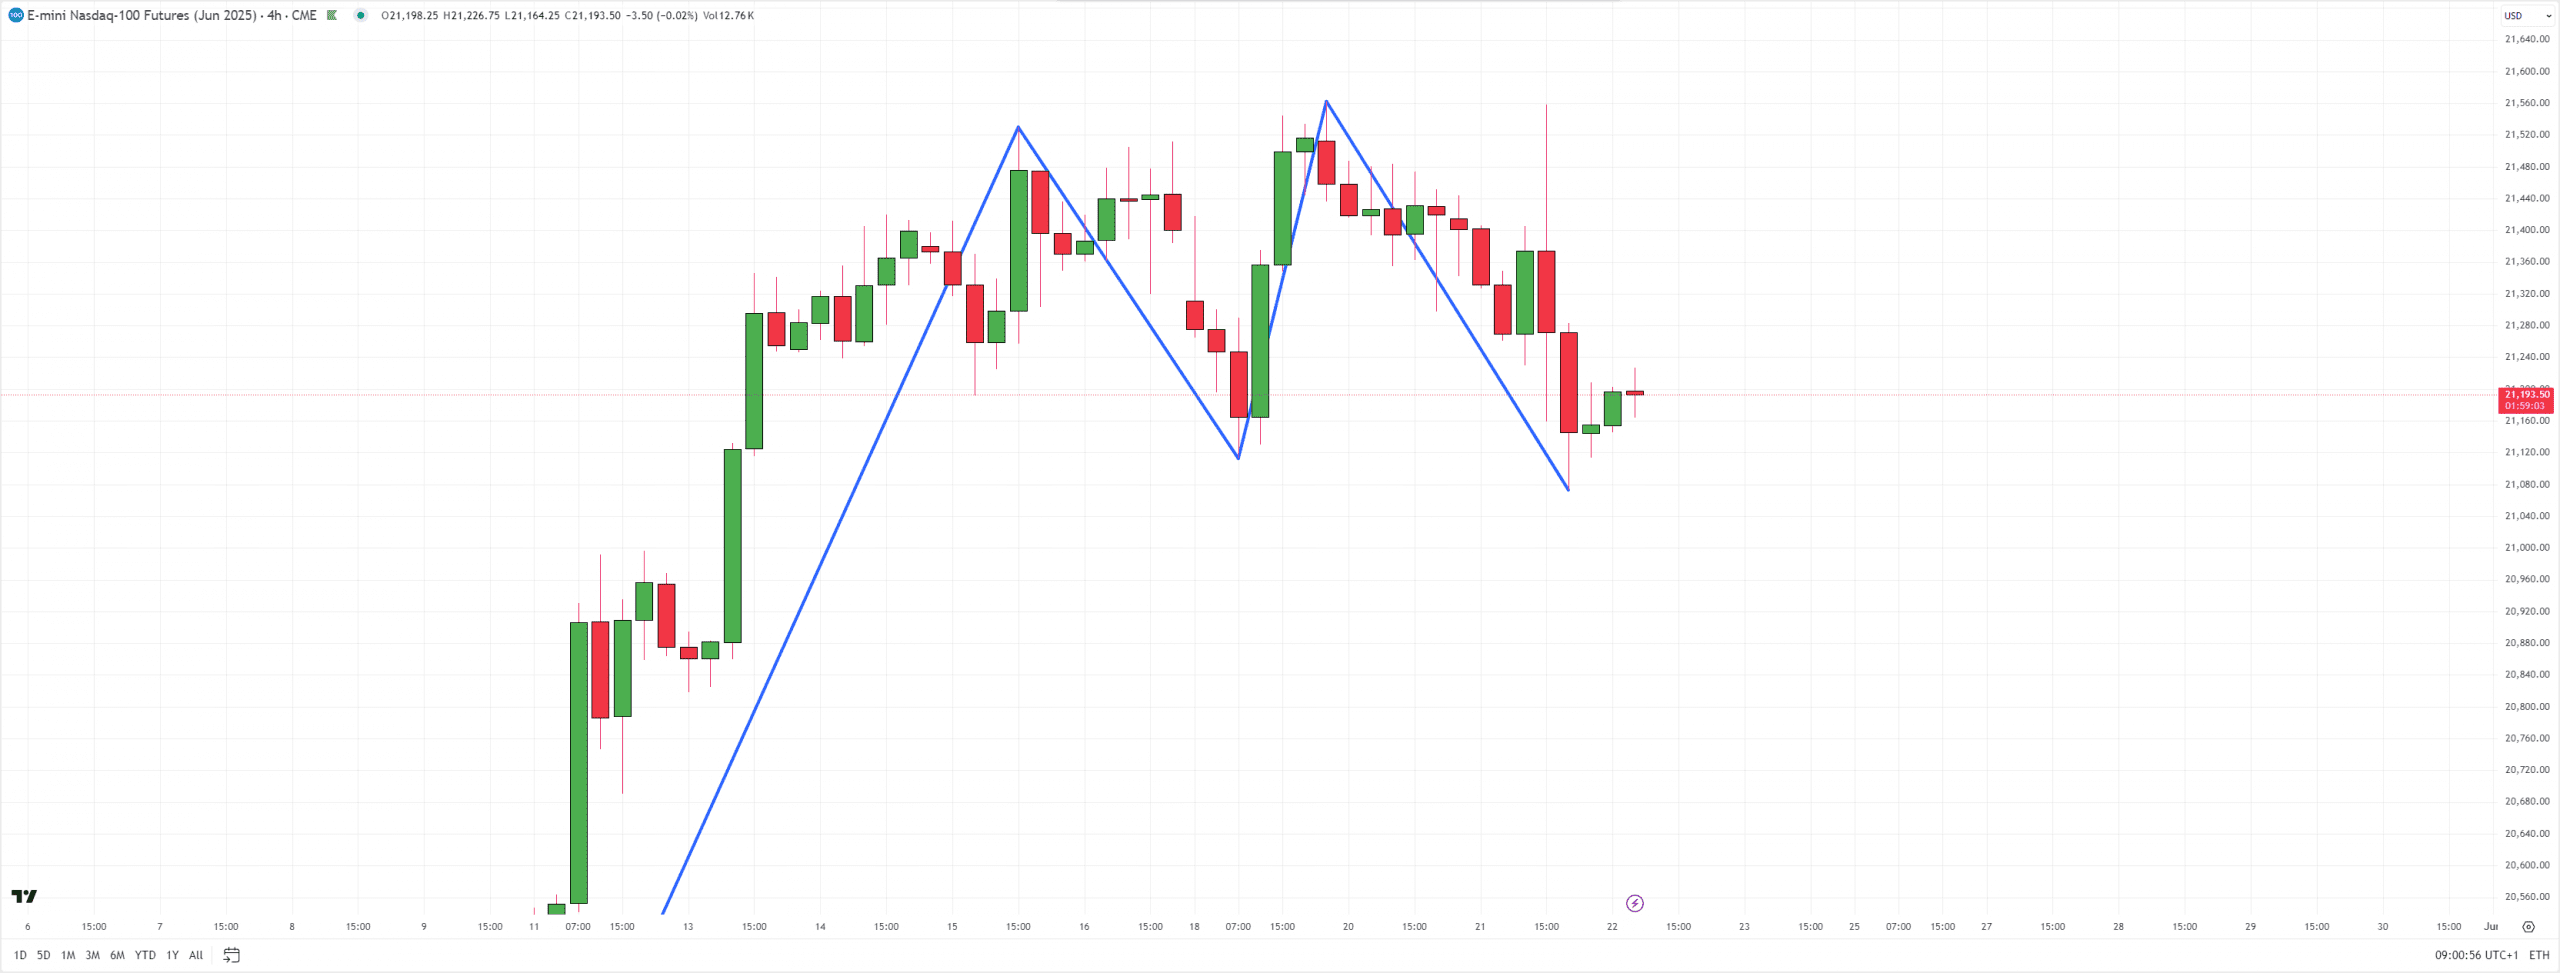
4 Hour - No Phase - Overall No Trend
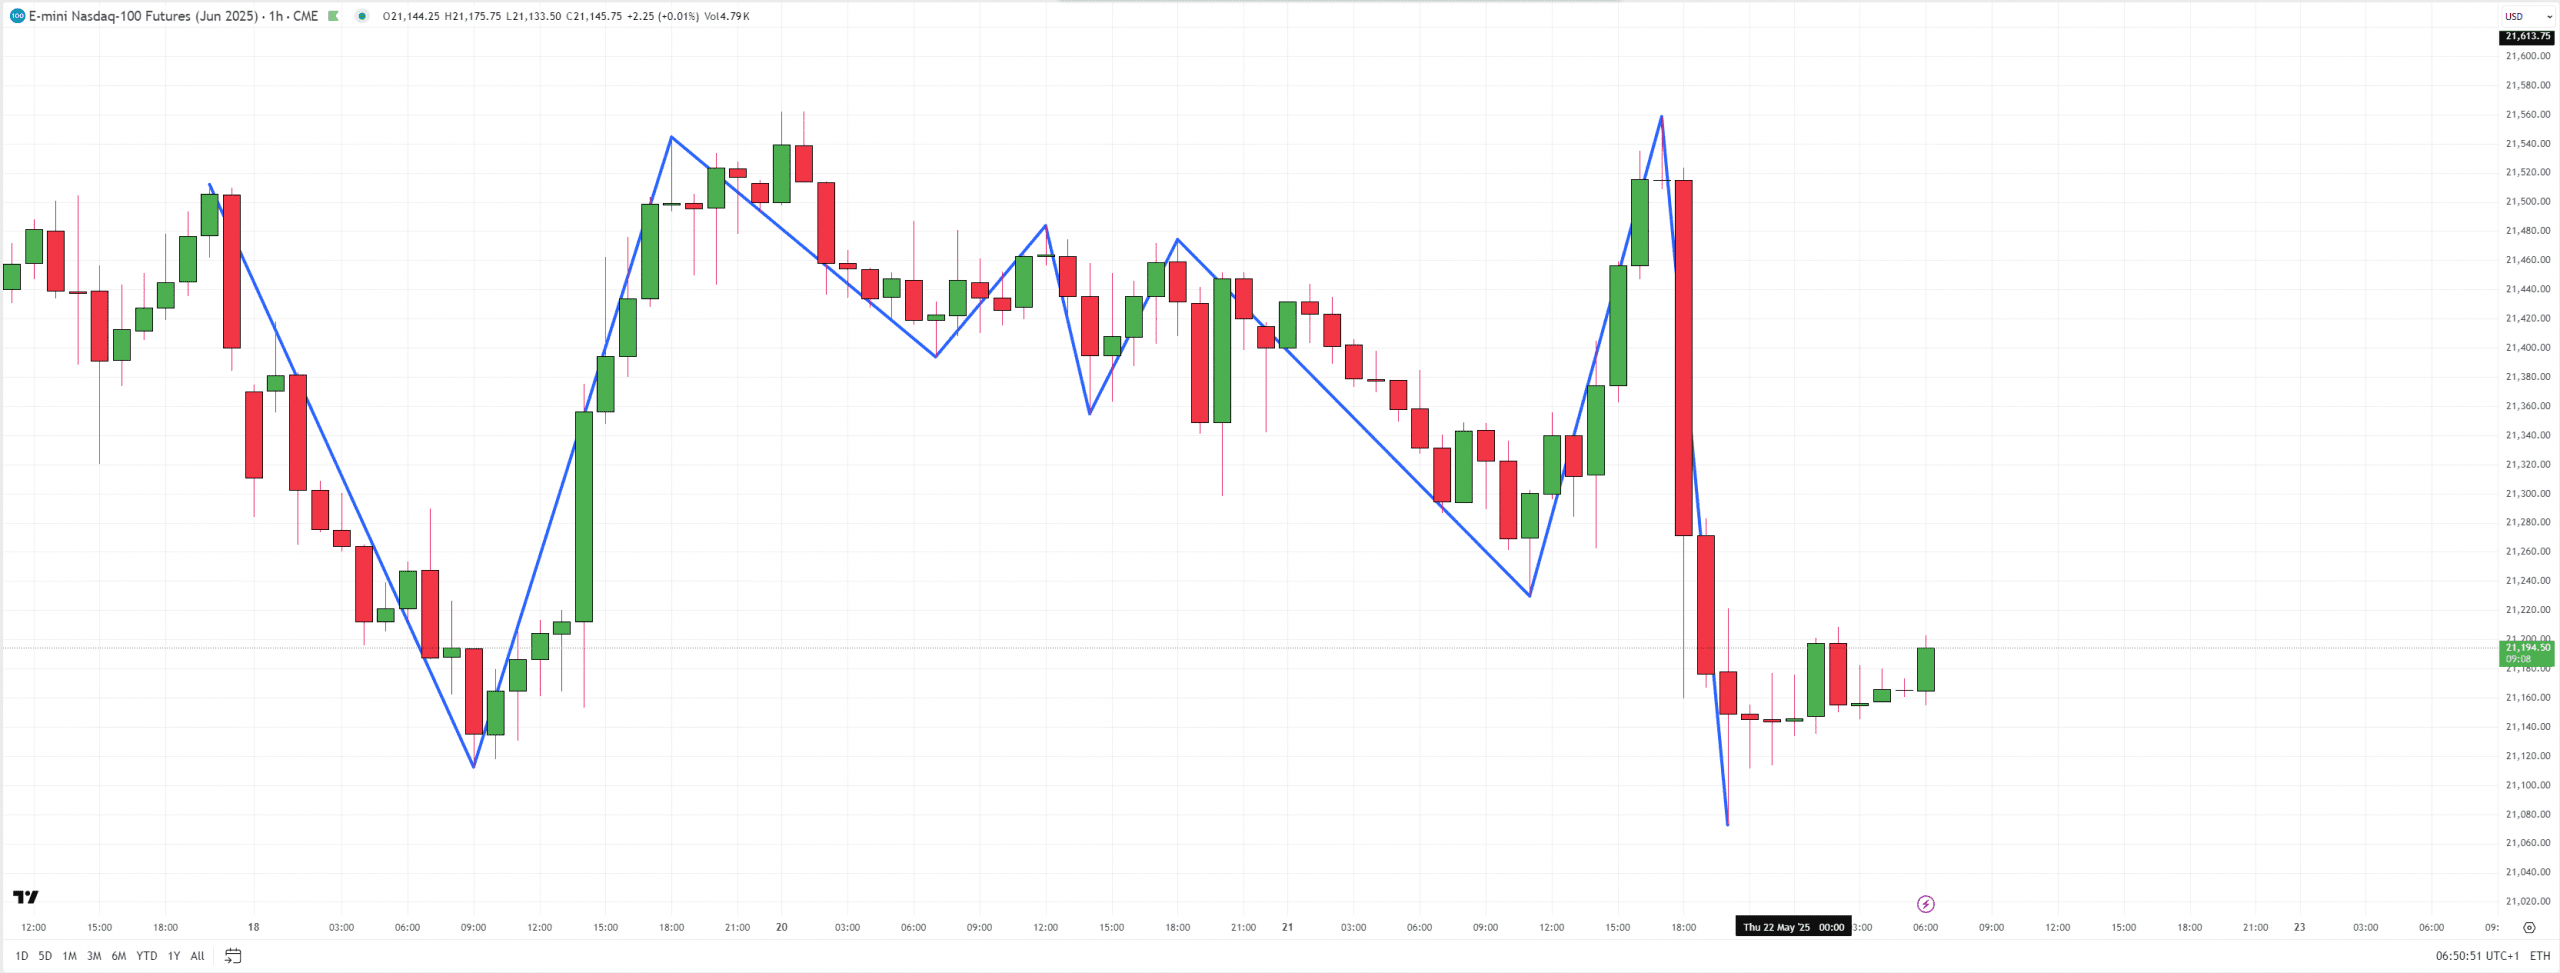
1 Hour - No Phase - Overall No Trend
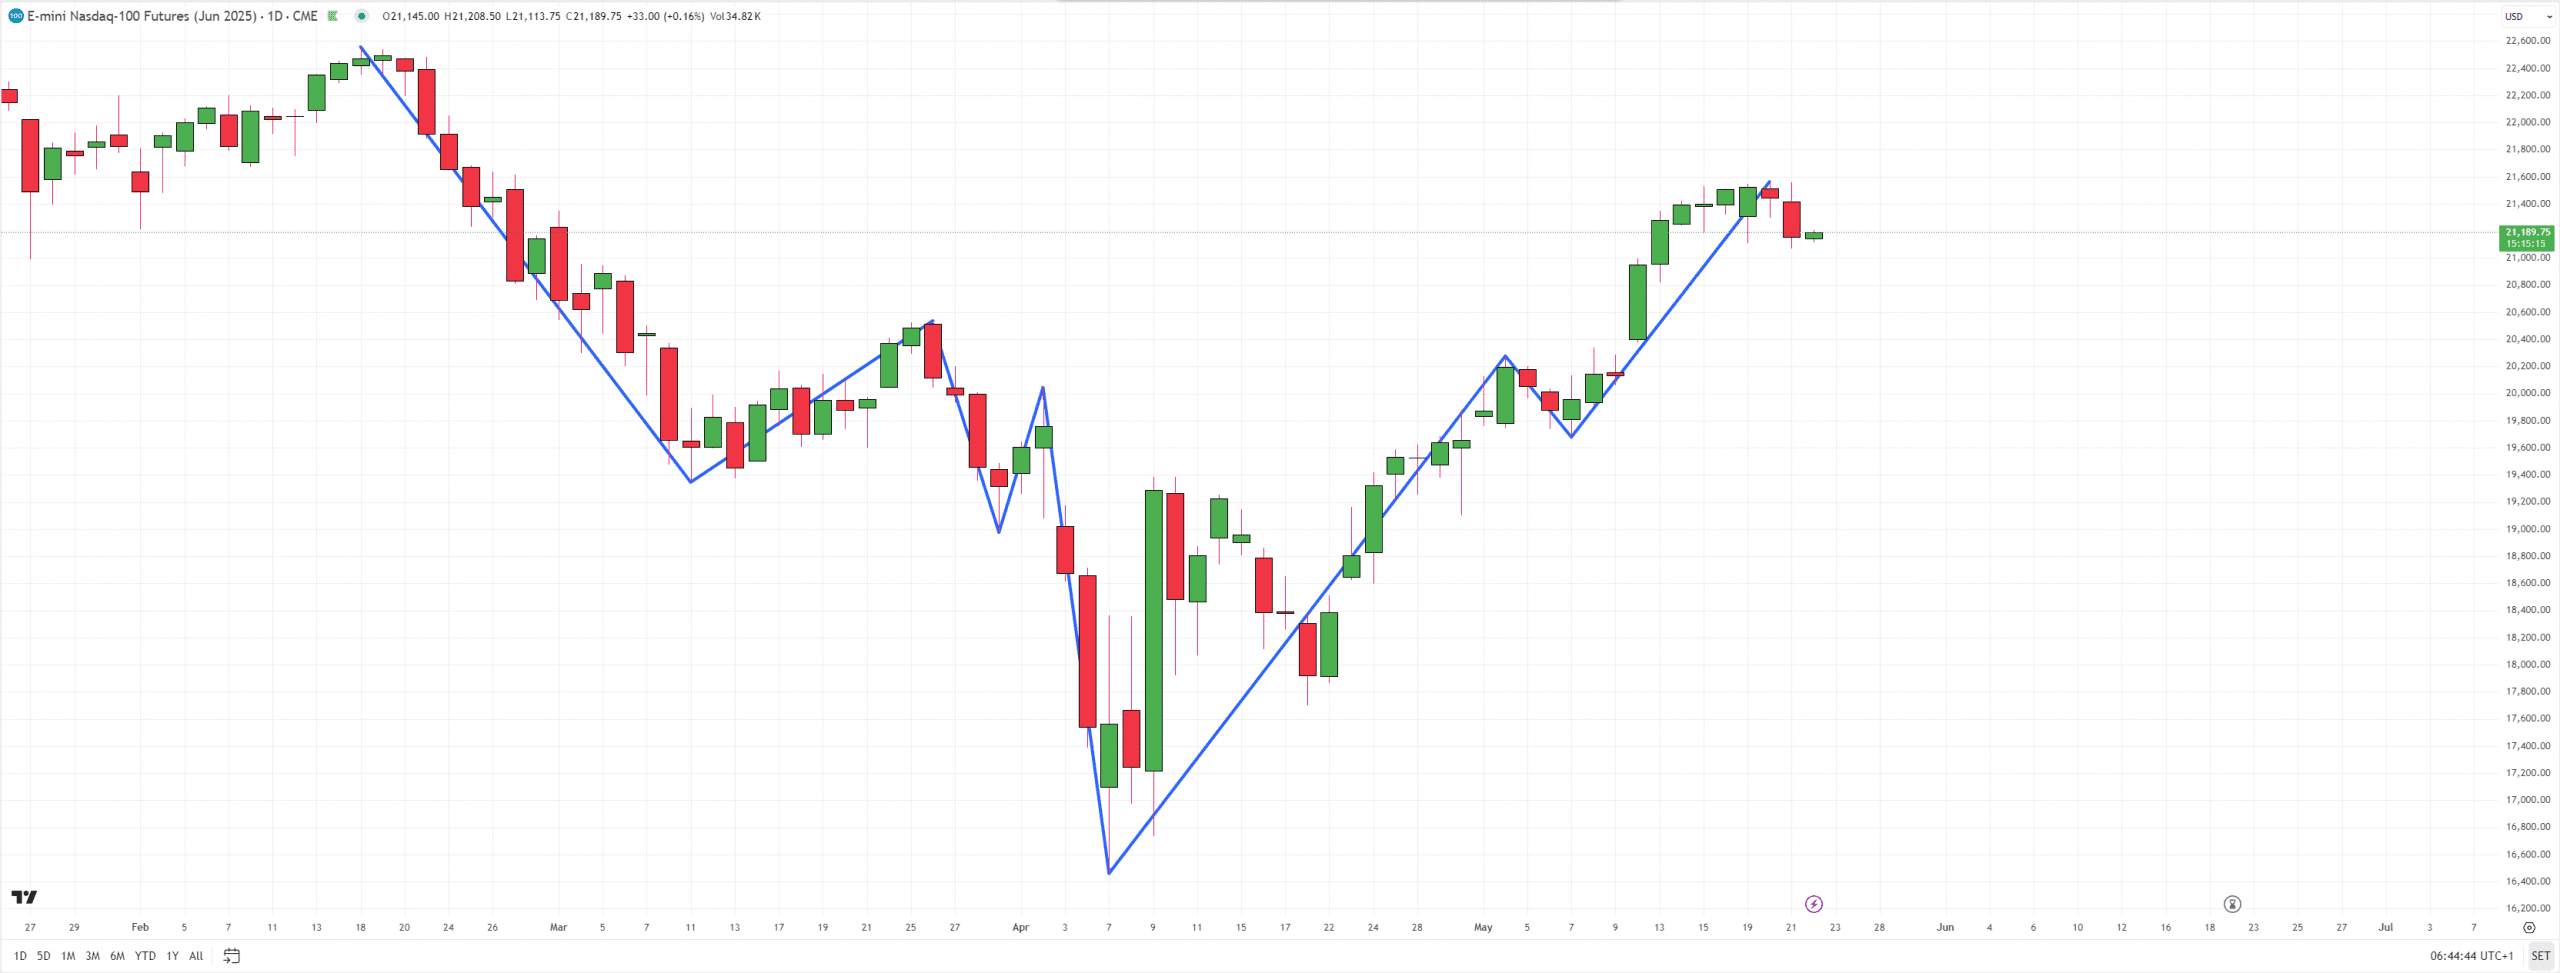
Over All Daily BIAS

- DAILY – As yesterdays candle closed below the previous days tail, we are still in an overall bullish state. Whilst we understand that the propriety direction of trades should be Bullish, after a break of structure we should be aware of a potential reversal.
- 4 Hour – As yesterdays candle closed above the previous days wick, we are still in an overall bullish state. Whilst we understand that the propriety direction of trades should be Bullish, after a break of structure we should be aware of a potential reversal.
- 1 Hours – As yesterdays candle closed above the previous days wick, we are still in an overall bullish state. Whilst we understand that the propriety direction of trades should be Bullish, after a break of structure we should be aware of a potential reversal.
My Prediction for the Strength of Today
Mapping After Asian Session
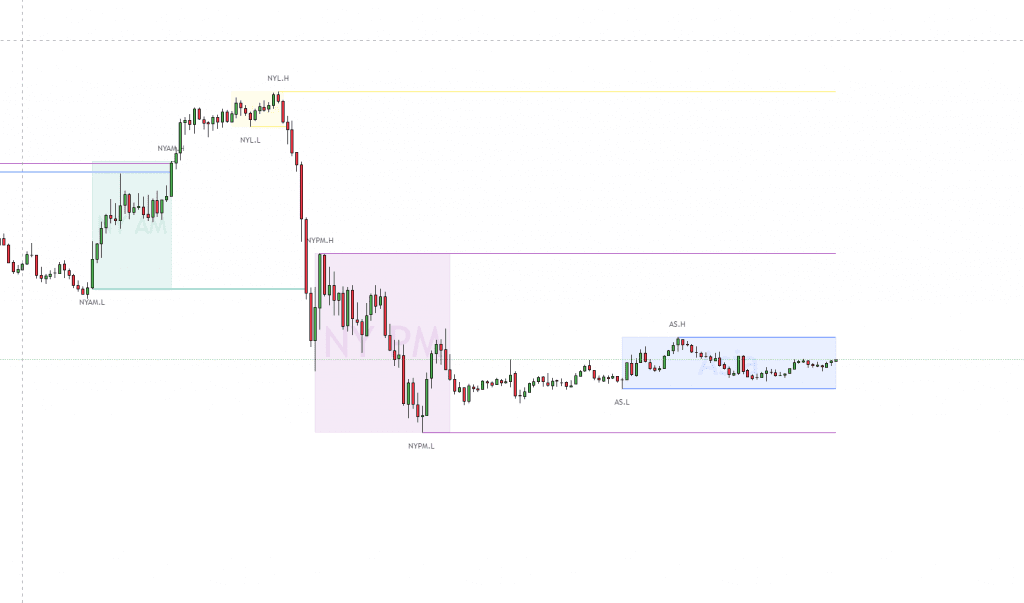
Liquidity – Lorem ipsum dolor sit amet, consectetur adipiscing elit. Ut elit tellus, luctus nec ullamcorper mattis, pulvinar dapibus leo.
Imbalance – Lorem ipsum dolor sit amet, consectetur adipiscing elit. Ut elit tellus, luctus nec ullamcorper mattis, pulvinar dapibus leo.
London
New York


Disclaimer: Trading Predictions
The trading predictions and market analyses provided on this blog are for informational and educational purposes only. They do not constitute financial advice or recommendations to buy, sell, or hold any financial instrument.
All views expressed are based on the author’s opinions, personal trading experience, and interpretation of market conditions. While every effort is made to ensure accuracy, there is no guarantee that any prediction or analysis will prove to be correct.
Trading financial markets involves risk, and past performance is not indicative of future results. You should always conduct your own research and consult with a licensed financial advisor before making any trading decisions.
The blog and its author(s) are not responsible for any loss or damage arising from reliance on the information provided.